IO分析工具iostat几乎无时不用,该工具实际上从/proc/diskstats读取相关数据。所以,理解了/proc/diskstats,也就理解了iostat。
/proc/diskstats
#cat /proc/diskstats
8    0 sda 33167 3812 1124805 428735 28338 77604 850432 3304811 0 384521 3733854
8    1 sda1 35713 1122730 106304 850432
8    2 sda2 1 2 0 0
8    5 sda5 1155 1161 0 0
各个字段的含义参考这里,不再赘述。
内核的相关代码:
//genhd.c
static int diskstats_show(struct seq_file *s, void *v)
{
	struct gendisk *gp = v;
	char buf[BDEVNAME_SIZE];
	int n = 0;

	preempt_disable();
	disk_round_stats(gp);
	preempt_enable();
	seq_printf(s, "%4d %4d %s %u %u %llu %u %u %u %llu %u %u %u %u\n",
		gp->major, n + gp->first_minor, disk_name(gp, n, buf), //disk_stats
		disk_stat_read(gp, reads), disk_stat_read(gp, read_merges),
		(unsigned long long)disk_stat_read(gp, read_sectors),
		jiffies_to_msecs(disk_stat_read(gp, read_ticks)),
		disk_stat_read(gp, writes), disk_stat_read(gp, write_merges),
		(unsigned long long)disk_stat_read(gp, write_sectors),
		jiffies_to_msecs(disk_stat_read(gp, write_ticks)),
		gp->in_flight,
		jiffies_to_msecs(disk_stat_read(gp, io_ticks)),
		jiffies_to_msecs(disk_stat_read(gp, time_in_queue)));

	/* now show all non-0 size partitions of it */
	for (n = 0; n < gp->minors - 1; n++) {
		struct hd_struct *hd = gp->part[n];

		if (hd && hd->nr_sects)
			seq_printf(s, "%4d %4d %s %u %u %u %u\n",
				gp->major, n + gp->first_minor + 1,
				disk_name(gp, n + 1, buf),
				hd->reads, hd->read_sectors,
				hd->writes, hd->write_sectors);
	}

//磁盘统计
struct disk_stats {
	unsigned read_sectors, write_sectors; //见drive_stat_acct
	unsigned reads, writes;//disk_round_stats
	unsigned read_merges, write_merges;//见drive_stat_acct
	unsigned read_ticks, write_ticks; //从请求进入队列到请求完成的时间累计(全部请求),见end_that_request_last
	unsigned io_ticks; //等待IO完成的等待时间的累计(全部请求)
	unsigned time_in_queue;//队列中所有请求的在队列中的等待(积累)时间,见disk_round_stats
};
read_sectors/writer_sectors:读/写扇区数量
read_merges/write_merges:合并读/写数量
time_in_queue:请求队列中的所有请求在队列的等待时间
io_ticks:util,IO时间(可以理解为磁盘在处理IO请求的总时间),iostat的util列。如果util为100%,表明磁盘一直在处理IO请求,IO满负载(但是也不全是这样,假如所有IO请求都是串行提交给driver,util为100%,但这并不一定表示磁盘的IO负载到了极限)。
上面几个参数都是在drive_stat_acct函数完成累加的,内核收到一个IO请求,就会调用该函数完成上面几个统计参数的累加:
__make_request -> add_request -> drive_stat_acct
reads, writes:读/写请求数
read_ticks, write_ticks:读/写请求所用时间(从进行队列到IO完成)
上面几个统计参数是在请求结束,内核在end_that_request_last函数中完成累加的。
void end_that_request_last(struct request *req)
{
	struct gendisk *disk = req->rq_disk;
	struct completion *waiting = req->waiting;

	if (unlikely(laptop_mode) && blk_fs_request(req))
		laptop_io_completion();

	if (disk && blk_fs_request(req)) {
		unsigned long duration = jiffies - req->start_time;///IO用时(排队+真正IO) ,start_time在__make_request中设置
		switch (rq_data_dir(req)) {
		    case WRITE:
			__disk_stat_inc(disk, writes);
			__disk_stat_add(disk, write_ticks, duration); //disk_stats
			break;
		    case READ:
			__disk_stat_inc(disk, reads);
			__disk_stat_add(disk, read_ticks, duration);
			break;
		}
		disk_round_stats(disk);
		disk->in_flight--;
	}
	__blk_put_request(req->q, req);
	/* Do this LAST! The structure may be freed immediately afterwards */
	if (waiting)
		complete(waiting);
}
可以看到io_ticks与time_in_queue是在函数disk_round_stats单独处理的,为什么呢?
字段io_ticks表示磁盘处于IO状态的时间,它与gendisk->in_flight相关:
Field 9 – # of I/Os currently in progress The only field that should go to zero. Incremented as requests are given to appropriate struct request_queue and decremented as they finish. Field 10 – # of milliseconds spent doing I/Os This field increases so long as field 9 is nonzero.
只要in_flight不为0(即磁盘正在处理IO请求),io_ticks就会增加,我们来看看它的计算:
void disk_round_stats(struct gendisk *disk)
{
	unsigned long now = jiffies;

	__disk_stat_add(disk, time_in_queue,
			disk->in_flight * (now - disk->stamp));
	disk->stamp = now;

	if (disk->in_flight)
		__disk_stat_add(disk, io_ticks, (now - disk->stamp_idle)); //util
	disk->stamp_idle = now;
}
io_ticks是通过stamp_idle来得到,每当有新的request(add_request),或者request完成(end_that_request_last)时,就会调用disk_round_stats完成stamp_idle的更新:
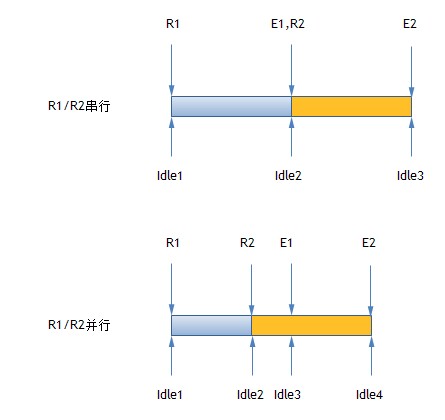
这样,当IO并发的时候,tot_ticks(util/svctm)就不会重复计算。
blkio.io_service_time
cgroup的blkio.io_service_time也是用于统计IO的在driver中的用时,不过,它是以每个IO request单独统计的。这样,当queue_depth > 1时,多个IO可能被重复统计,这会大于driver真正的IO用时。不过,这对于单个IO request本身来说,统计更加准确。
blkio.io_service_time - Total amount of time between request dispatch and request completion for the IOs done by this cgroup. This is in nanoseconds to make it meaningful for flash devices too. For devices with queue depth of 1, this time represents the actual service time. When queue_depth > 1, that is no longer true as requests may be served out of order. This may cause the service time for a given IO to include the service time of multiple IOs when served out of order which may result in total io_service_time > actual time elapsed. This time is further divided by the type of operation - read or write, sync or async. First two fields specify the major and minor number of the device, third field specifies the operation type and the fourth field specifies the io_service_time in ns.
iostat
来看看iostat如何使用/proc/diskstats中的数据(取自sysstat-6.0.2)
struct io_stats {
   /* # of read operations issued to the device */
   unsigned long rd_ios				__attribute__ ((aligned (8)));
   /* # of read requests merged */
   unsigned long rd_merges			__attribute__ ((packed));
   /* # of sectors read */
   unsigned long long rd_sectors		__attribute__ ((packed));
   /* Time of read requests in queue */
   unsigned long rd_ticks			__attribute__ ((packed));
   /* # of write operations issued to the device */
   unsigned long wr_ios				__attribute__ ((packed));
   /* # of write requests merged */
   unsigned long wr_merges			__attribute__ ((packed));
   /* # of sectors written */
   unsigned long long wr_sectors		__attribute__ ((packed));
   /* Time of write requests in queue */
   unsigned long wr_ticks			__attribute__ ((packed));
   /* # of I/Os in progress *////in_flight,iostat实际上并没有使用该值
   unsigned long ios_pgr			__attribute__ ((packed));
   /* # of ticks total (for this device) for I/O */ ///io_ticks,设备进行IO的时间
   unsigned long tot_ticks			__attribute__ ((packed));
   /* # of ticks requests spent in queue */ ///time_in_queue,在队列中的时间
   unsigned long rq_ticks			__attribute__ ((packed));
   /* # of I/O done since last reboot */
   unsigned long dk_drive			__attribute__ ((packed));
   /* # of blocks read */
   unsigned long dk_drive_rblk			__attribute__ ((packed));
   /* # of blocks written */
   unsigned long dk_drive_wblk			__attribute__ ((packed));
};


void write_ext_stat(int curr, unsigned long long itv, int flags, int fctr,
		    struct io_hdr_stats *shi, struct io_stats *ioi,
		    struct io_stats *ioj)
{
   unsigned long long rd_sec, wr_sec;
   double tput, util, await, svctm, arqsz, nr_ios;

   /*
    * Counters overflows are possible, but don't need to be handled in
    * a special way: the difference is still properly calculated if the
    * result is of the same type as the two values.
    * Exception is field rq_ticks which is incremented by the number of
    * I/O in progress times the number of milliseconds spent doing I/O.
    * But the number of I/O in progress (field ios_pgr) happens to be
    * sometimes negative...
    */
   nr_ios = (ioi->rd_ios - ioj->rd_ios) + (ioi->wr_ios - ioj->wr_ios);//IO个数
   tput   = ((double) nr_ios) * HZ / itv; //单位时间IO个数
   util = S_VALUE(ioj->tot_ticks, ioi->tot_ticks, itv);//单位时间内IO时间(ms)
   svctm  = tput ? util / tput : 0.0; //单位时间内每个IO的平均用时(真正IO用时) ms
   /*
    * kernel gives ticks already in milliseconds for all platforms
    * => no need for further scaling.
    */
   await  = nr_ios ?
      ((ioi->rd_ticks - ioj->rd_ticks) + (ioi->wr_ticks - ioj->wr_ticks)) /
      nr_ios : 0.0; //每个IO完成的平均用时(包含排队+IO) ms

   rd_sec = ioi->rd_sectors - ioj->rd_sectors;
   if ((ioi->rd_sectors < ioj->rd_sectors) && (ioj->rd_sectors <= 0xffffffff))
      rd_sec &= 0xffffffff;
   wr_sec = ioi->wr_sectors - ioj->wr_sectors;
   if ((ioi->wr_sectors < ioj->wr_sectors) && (ioj->wr_sectors <= 0xffffffff))
      wr_sec &= 0xffffffff;

   arqsz  = nr_ios ? (rd_sec + wr_sec) / nr_ios : 0.0;//每个请求的大小

   printf("%-10s", shi->name);
   if (strlen(shi->name) > 10)
      printf("\n          ");
   /*       rrq/s wrq/s   r/s   w/s  rsec  wsec   r?B   w?B  rqsz  qusz await svctm %util */
   printf(" %6.2f %6.2f %5.2f %5.2f %7.2f %7.2f %8.2f %8.2f %8.2f %8.2f %7.2f %6.2f %6.2f\n",
	  S_VALUE(ioj->rd_merges, ioi->rd_merges, itv),
	  S_VALUE(ioj->wr_merges, ioi->wr_merges, itv),
	  S_VALUE(ioj->rd_ios, ioi->rd_ios, itv),
	  S_VALUE(ioj->wr_ios, ioi->wr_ios, itv),
	  ll_s_value(ioj->rd_sectors, ioi->rd_sectors, itv),
	  ll_s_value(ioj->wr_sectors, ioi->wr_sectors, itv),
	  ll_s_value(ioj->rd_sectors, ioi->rd_sectors, itv) / fctr,
	  ll_s_value(ioj->wr_sectors, ioi->wr_sectors, itv) / fctr,
	  arqsz, ///avgrq-sz
	  S_VALUE(ioj->rq_ticks, ioi->rq_ticks, itv) / 1000.0, //avgqu-sz
	  await,
	  /* The ticks output is biased to output 1000 ticks per second */
	  svctm,
	  /* Again: ticks in milliseconds */
	  util / 10.0); ///(ms/1000)*100% = ms/10, iostat最小单位为second
}
io个数:
nr_ios = (ioi->rd_ios - ioj->rd_ios) + (ioi->wr_ios - ioj->wr_ios);//IO个数
await的计算:
   await  = nr_ios ?
      ((ioi->rd_ticks - ioj->rd_ticks) + (ioi->wr_ticks - ioj->wr_ticks)) /
      nr_ios : 0.0; //每个IO完成的平均用时(包含排队+IO)
svctm:
   tput   = ((double) nr_ios) * HZ / itv; //单位时间IO个数
   util = S_VALUE(ioj->tot_ticks, ioi->tot_ticks, itv);//单位时间内IO时间(ms)
   svctm  = tput ? util / tput : 0.0; //单位时间内每个IO的平均用时(真正IO用时) ms
可以看到,iostat并没有使用gendisk->in_flight。